Lambda Powertools: Oomph up your lambda
Easily adopt best practices such as tracing, structured logging, custom metrics, and more.

I am an AWS Certified Solutions Architect with over 12+ years of experience with a primary focus on AWS serverless solutions, AWS CDK, event driven architecture and Python.
Intro
This post will cover how to use the Lambda Powertools library to implement some of the AWS Well-Architected Framework best practices without writing lots of custom code.
Powertools cover extensive use cases, although we will cover how we can get started by adding only a few lines of code in Lambda functions in this post. The example here is covered using Python, but the library is also available for Java, and a beta is just released for Typescript as well.
Getting Started
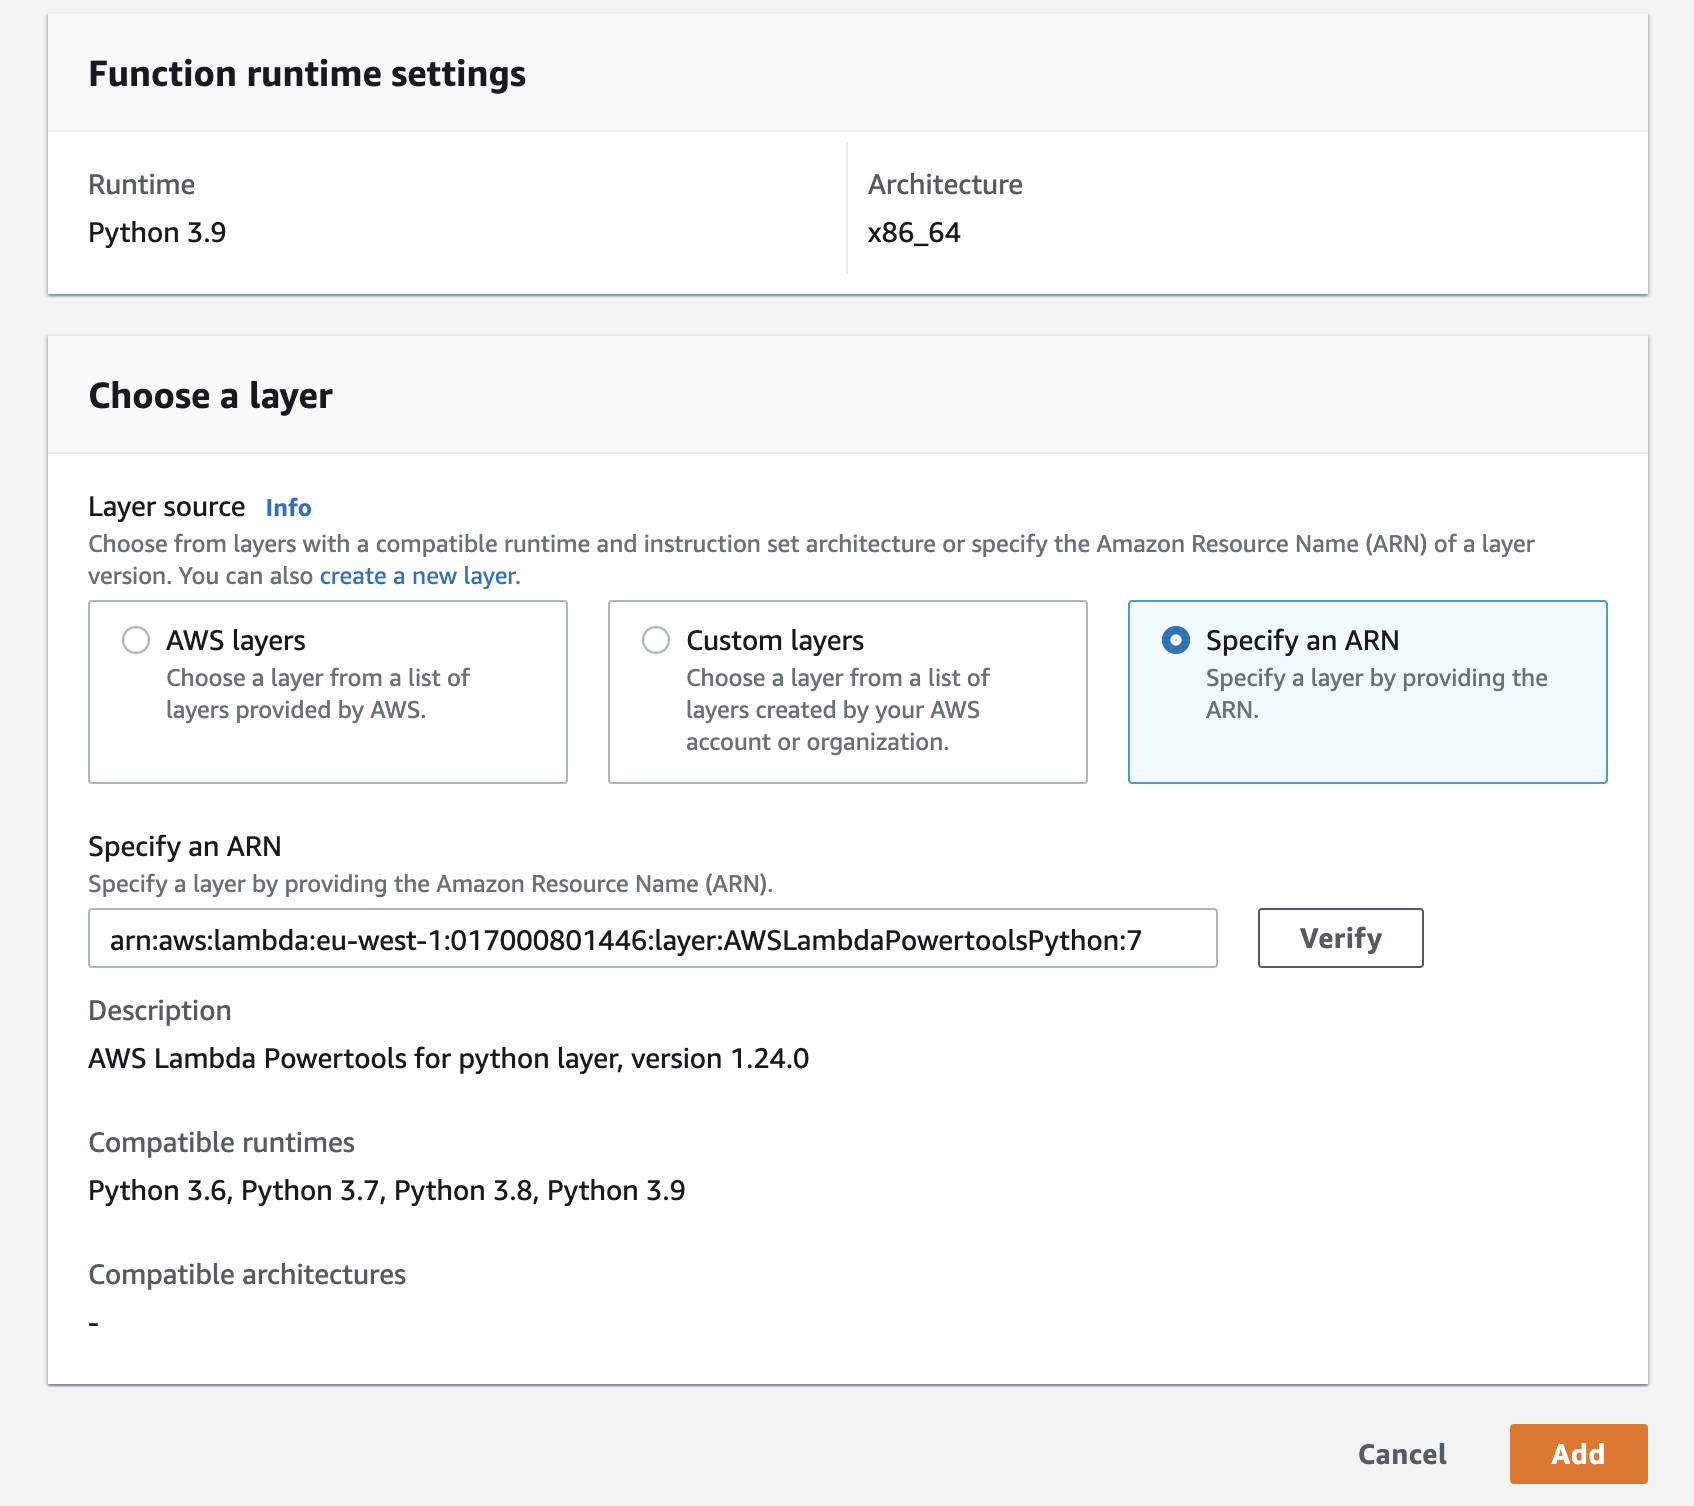
We add the Powertools library as a dependency for our functions via requirement.txt by including this line "aws-lambda-powertools". Or by adding the Lambda Layer using ARN in the below format:
arn:aws:lambda:{region}:017000801446:layer:AWSLambdaPowertoolsPython:7
Below screenshot shows the creation of Lambda Layer for the "eu-west-1" region.

Lambda Setup
As usual, we will start with the import of the library and then create "logger", "tracer", and "metrics" objects. Following this, we have made three decorators:
from aws_lambda_powertools import Logger, Tracer, Metrics

logger = Logger()
tracer = Tracer()
metrics = Metrics()

@metrics.log_metrics(capture_cold_start_metric=True)
@logger.inject_lambda_context(log_event=True)
@tracer.capture_lambda_handler
def lambda_handler(event, context):
    ...
Metrics: @metrics.log_metrics(capture_cold_start_metric=True)
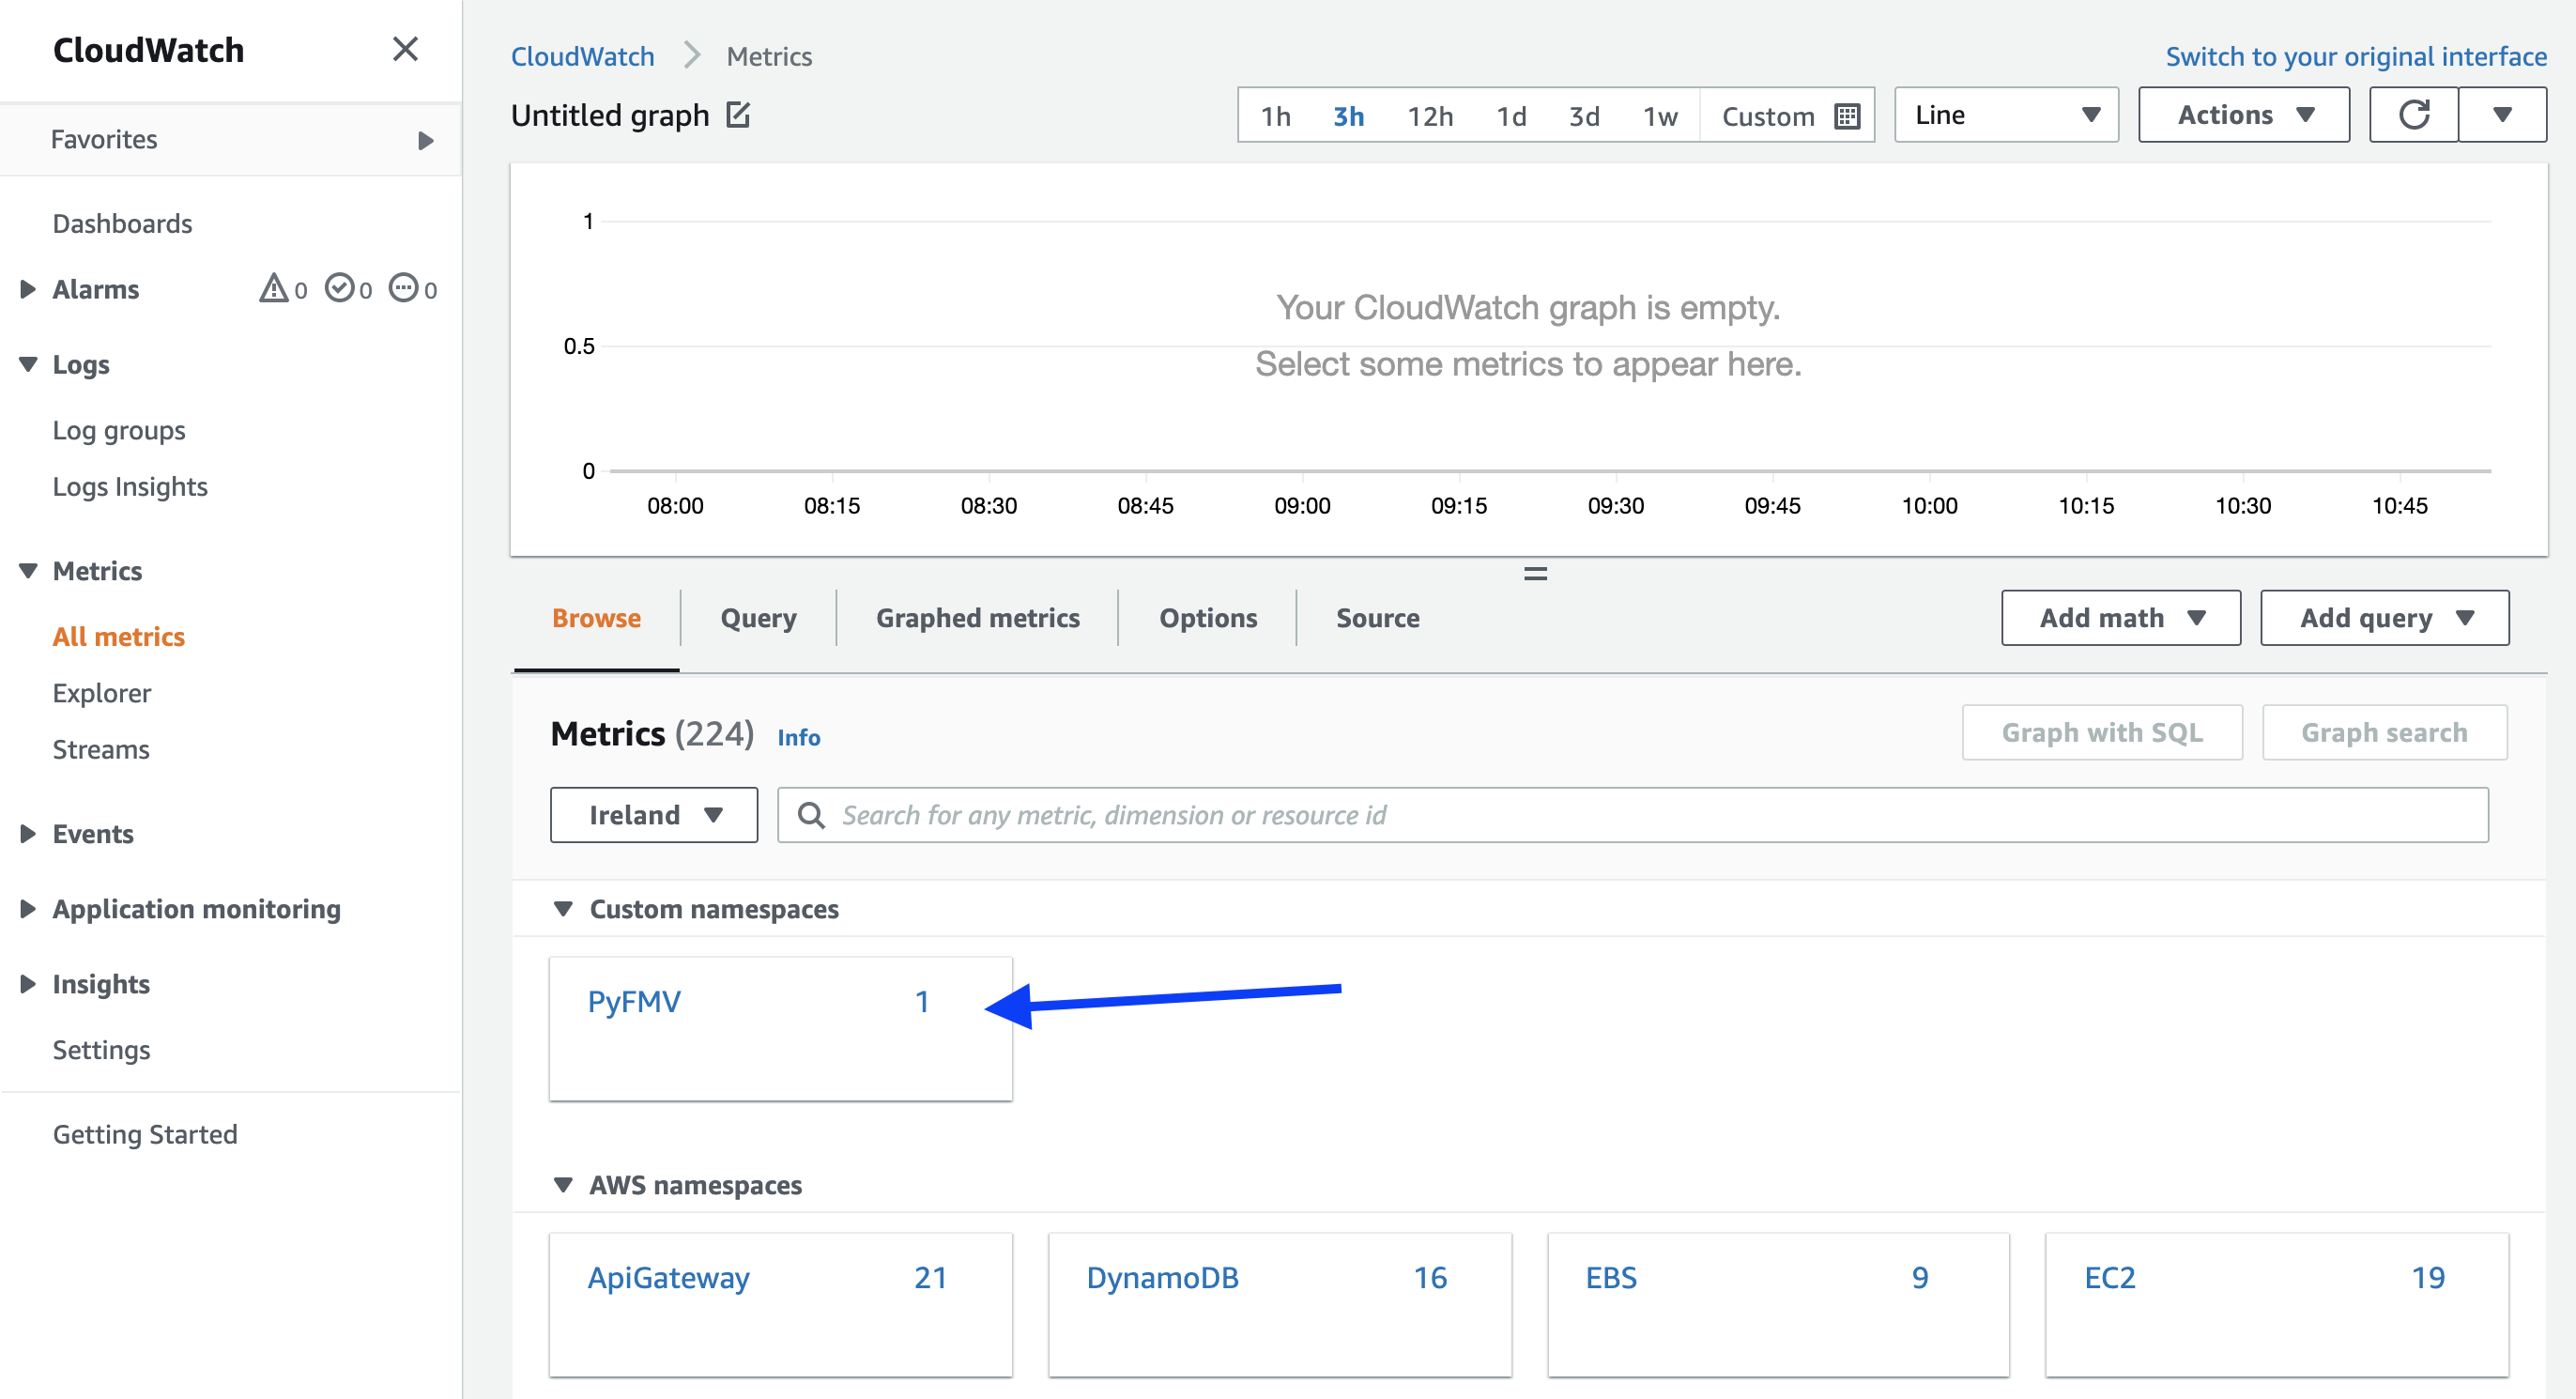
Metrics object allow us to create custom CloudWatch metrics for our application. In our example, we pass the capture_cold_start_metric parameter to the log_metrics decorator to automatically create a cold start metric. It's optional but helps to monitor the cold starts easily.
Powertools metrics require two environment variables:
POWERTOOLS_METRICS_NAMESPACE: "PyFMV" POWERTOOLS_SERVICE_NAME: "my_lambda_service"
POWERTOOLS_METRICS_NAMESPACE maps to the CloudWatch namespace and POWERTOOLS_SERVICE_NAME maps to the CloudWatch service name.

One of the key features of Powertools is that it allows us to emit custom metrics by calling add_metrics in our code block by just a single line of code:
metrics.add_metric(name="my_custom_metric", unit="Count", value=1)
Logger: @logger.inject_lambda_context(log_event=True)
The logger object output structured logs. The @logger.inject_lambda_context decorator with our Lambda handler automatically adds information about the Lambda context for log lines emitted from within the handler.
The** log_event** parameter is optional, and it's set to False by default. Passing the log_event parameter as True appends the event received by the handler in the log. It should only be used for initial debugging when required, and we should remove it before production release to stop the leak of sensitive event information in the logs. The standard usage format for the logger is: logger.()
NOTE: There are additional attributes that can be passed alongside the output message
try:
    ...code...
    logger.info(f"Processing complete for {client}")
    raise ValueError("something went wrong")
except Exception:
    logger.exception("Received an exception")
Tracer: @tracer.capture_lambda_handler
By calling the @tracer.capture_lambda_handler, the library sends traces and metadata from the execution of the Lambda function to AWS X-Ray. This allows us to view a generated service map in the AWS X-Ray console, giving us an overview of all the traffic flowing through our application. If our Lambda contains other functions, we can also trace them using @tracer.capture_method:
@tracer.capture_lambda_handler
def lambda_handler(event, context):
     ... code...

@tracer.capture_method
def other_function(data_input):
    ... code...
For tracing to work, we need to enable "active tracing". You can do this via AWS console Lambda detail page > Configuration > Monitoring and operations tools.

If the Lambda is triggered via API gateway, activating the X-Ray at the API-Gateway will monitor the request from the API gateway stage. The X-Ray can be enabled by navigating to stages > Logs/Tracing > Enable X-Ray Tracing.

The above AWS console examples are a good way to test powertools, but if you want to include them in your SAM template, the below example of the "Globals" section will cover the pre-requisites discussed above.
Globals:
    Function:
        Tracing: Active
        Environment:
            Variables:
                POWERTOOLS_METRICS_NAMESPACE: "app_name_space"
                POWERTOOLS_SERVICE_NAME: "service_name"
       Layers:
           - !Sub arn:aws:lambda:${AWS::Region}:017000801446:layer:AWSLambdaPowertoolsPython:7

     Api:
          TracingEnabled: true
As stated earlier, this blog scratches the surface of Powertools. We can achieve much more with trace, log, and metrics than we covered here. There are other features like middleware factory and batch processing validations, parser etc. I do recommend going over the docs at https://awslabs.github.io/aws-lambda-powertools-python/latest/


